
Watch
Supercharts + watchlists
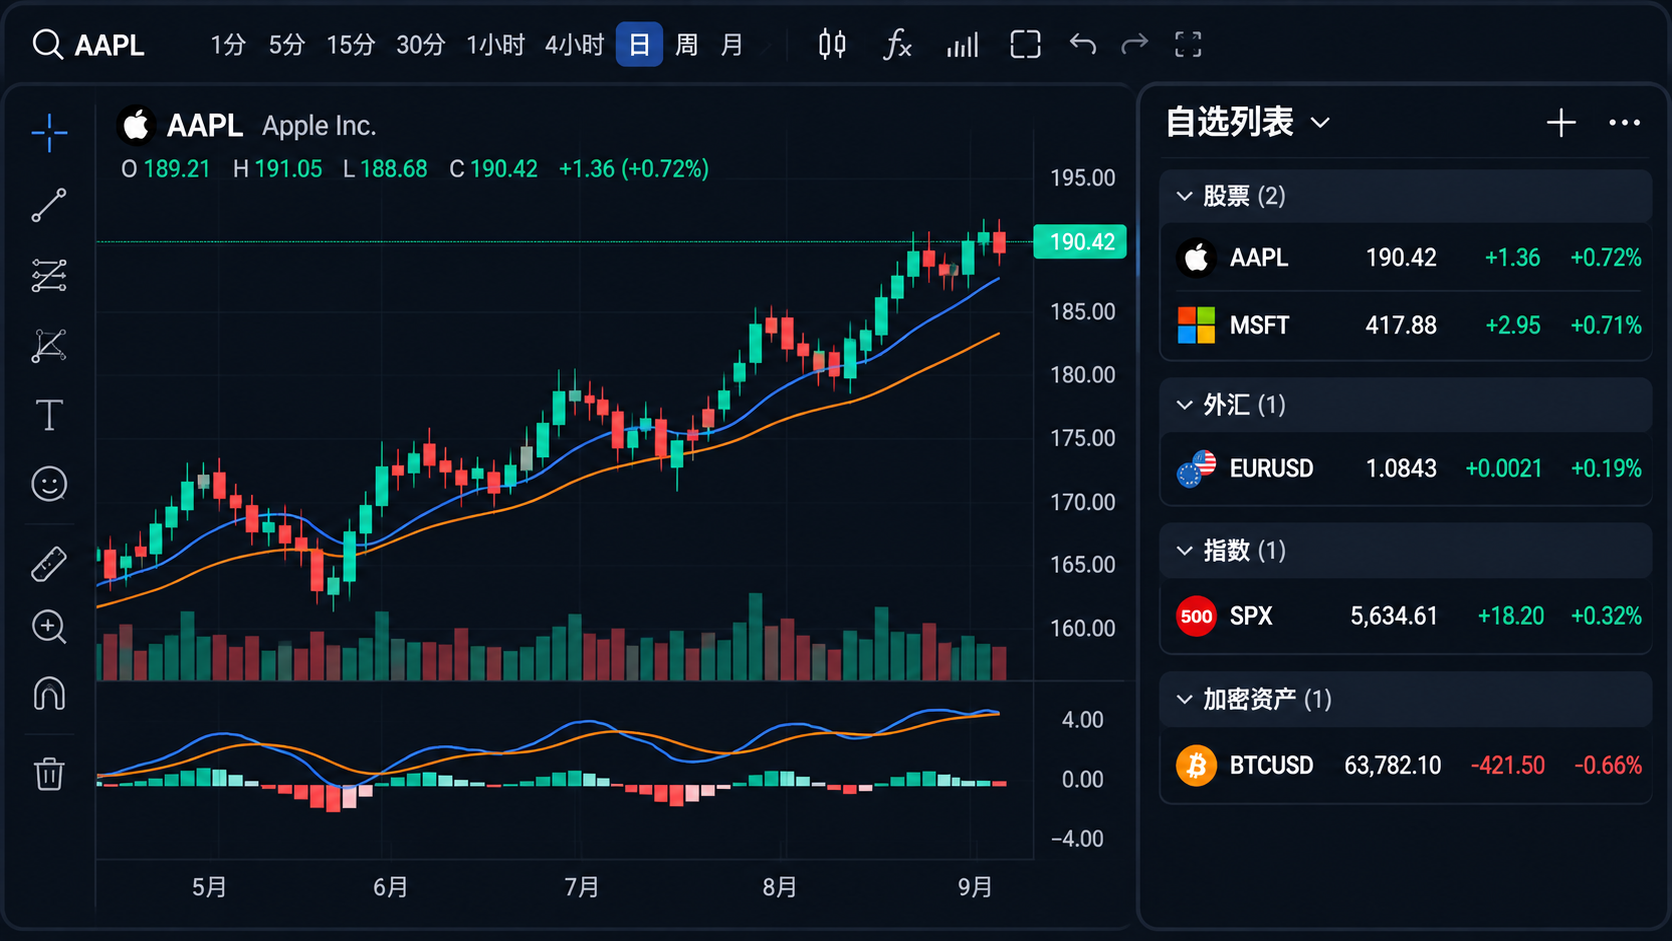
Park your focus symbols in a list, then use Supercharts to study structure and trend.
From watching price action to testing your own ideas, get more out of every tool
TradingView isn’t just a place to stare at prices. It’s a full research workspace with charts, indicators, multi-chart layouts, smart alerts, and custom strategy tools. The visuals are straightforward, the pieces mix and match, and you can look at trends, key levels, and signals without losing the plot.
Whether you’re still learning candlesticks or already writing Pine Script, there’s room to work your way. Set up the charts around the symbols, timeframes, and habits you already have — and fold market watching into a routine that feels less scattered.
01
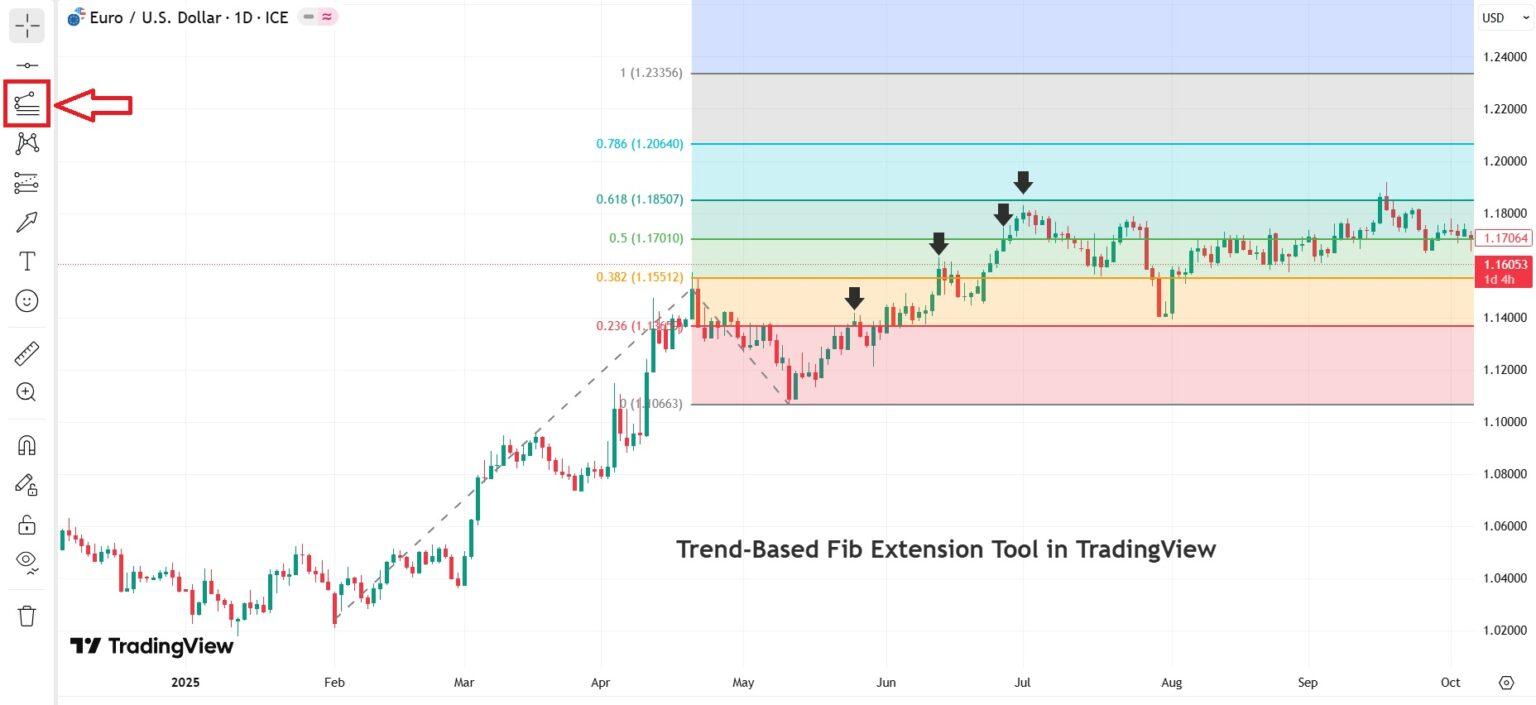
TradingView’s Supercharts give you a flexible canvas for research. Switch chart types, timeframes, and drawings so you can follow the trend, mark key areas, and tweak the workspace until it feels right.
02
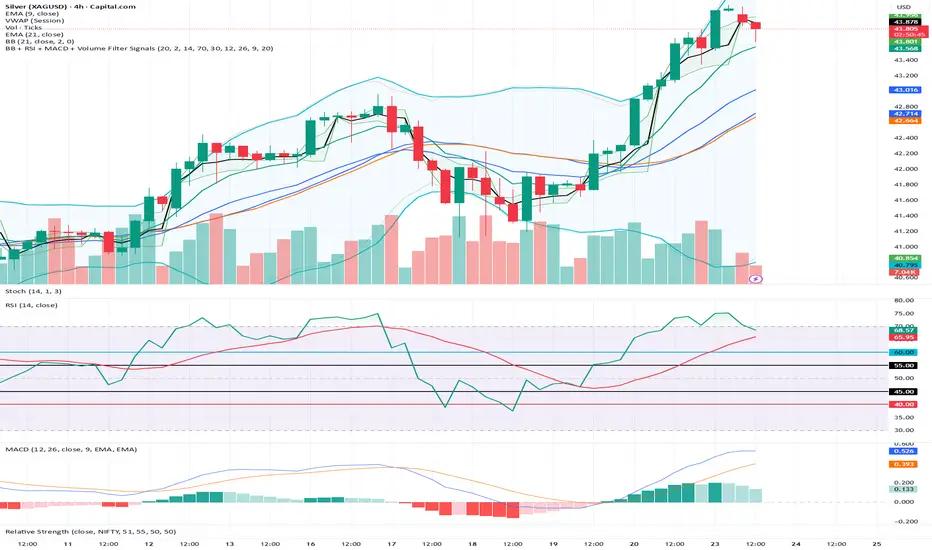
From moving averages and RSI to MACD and Bollinger Bands, you’ve got the classics covered. Dial in the parameters, stack a few together, and look at trend, momentum, and volatility side by side.
03
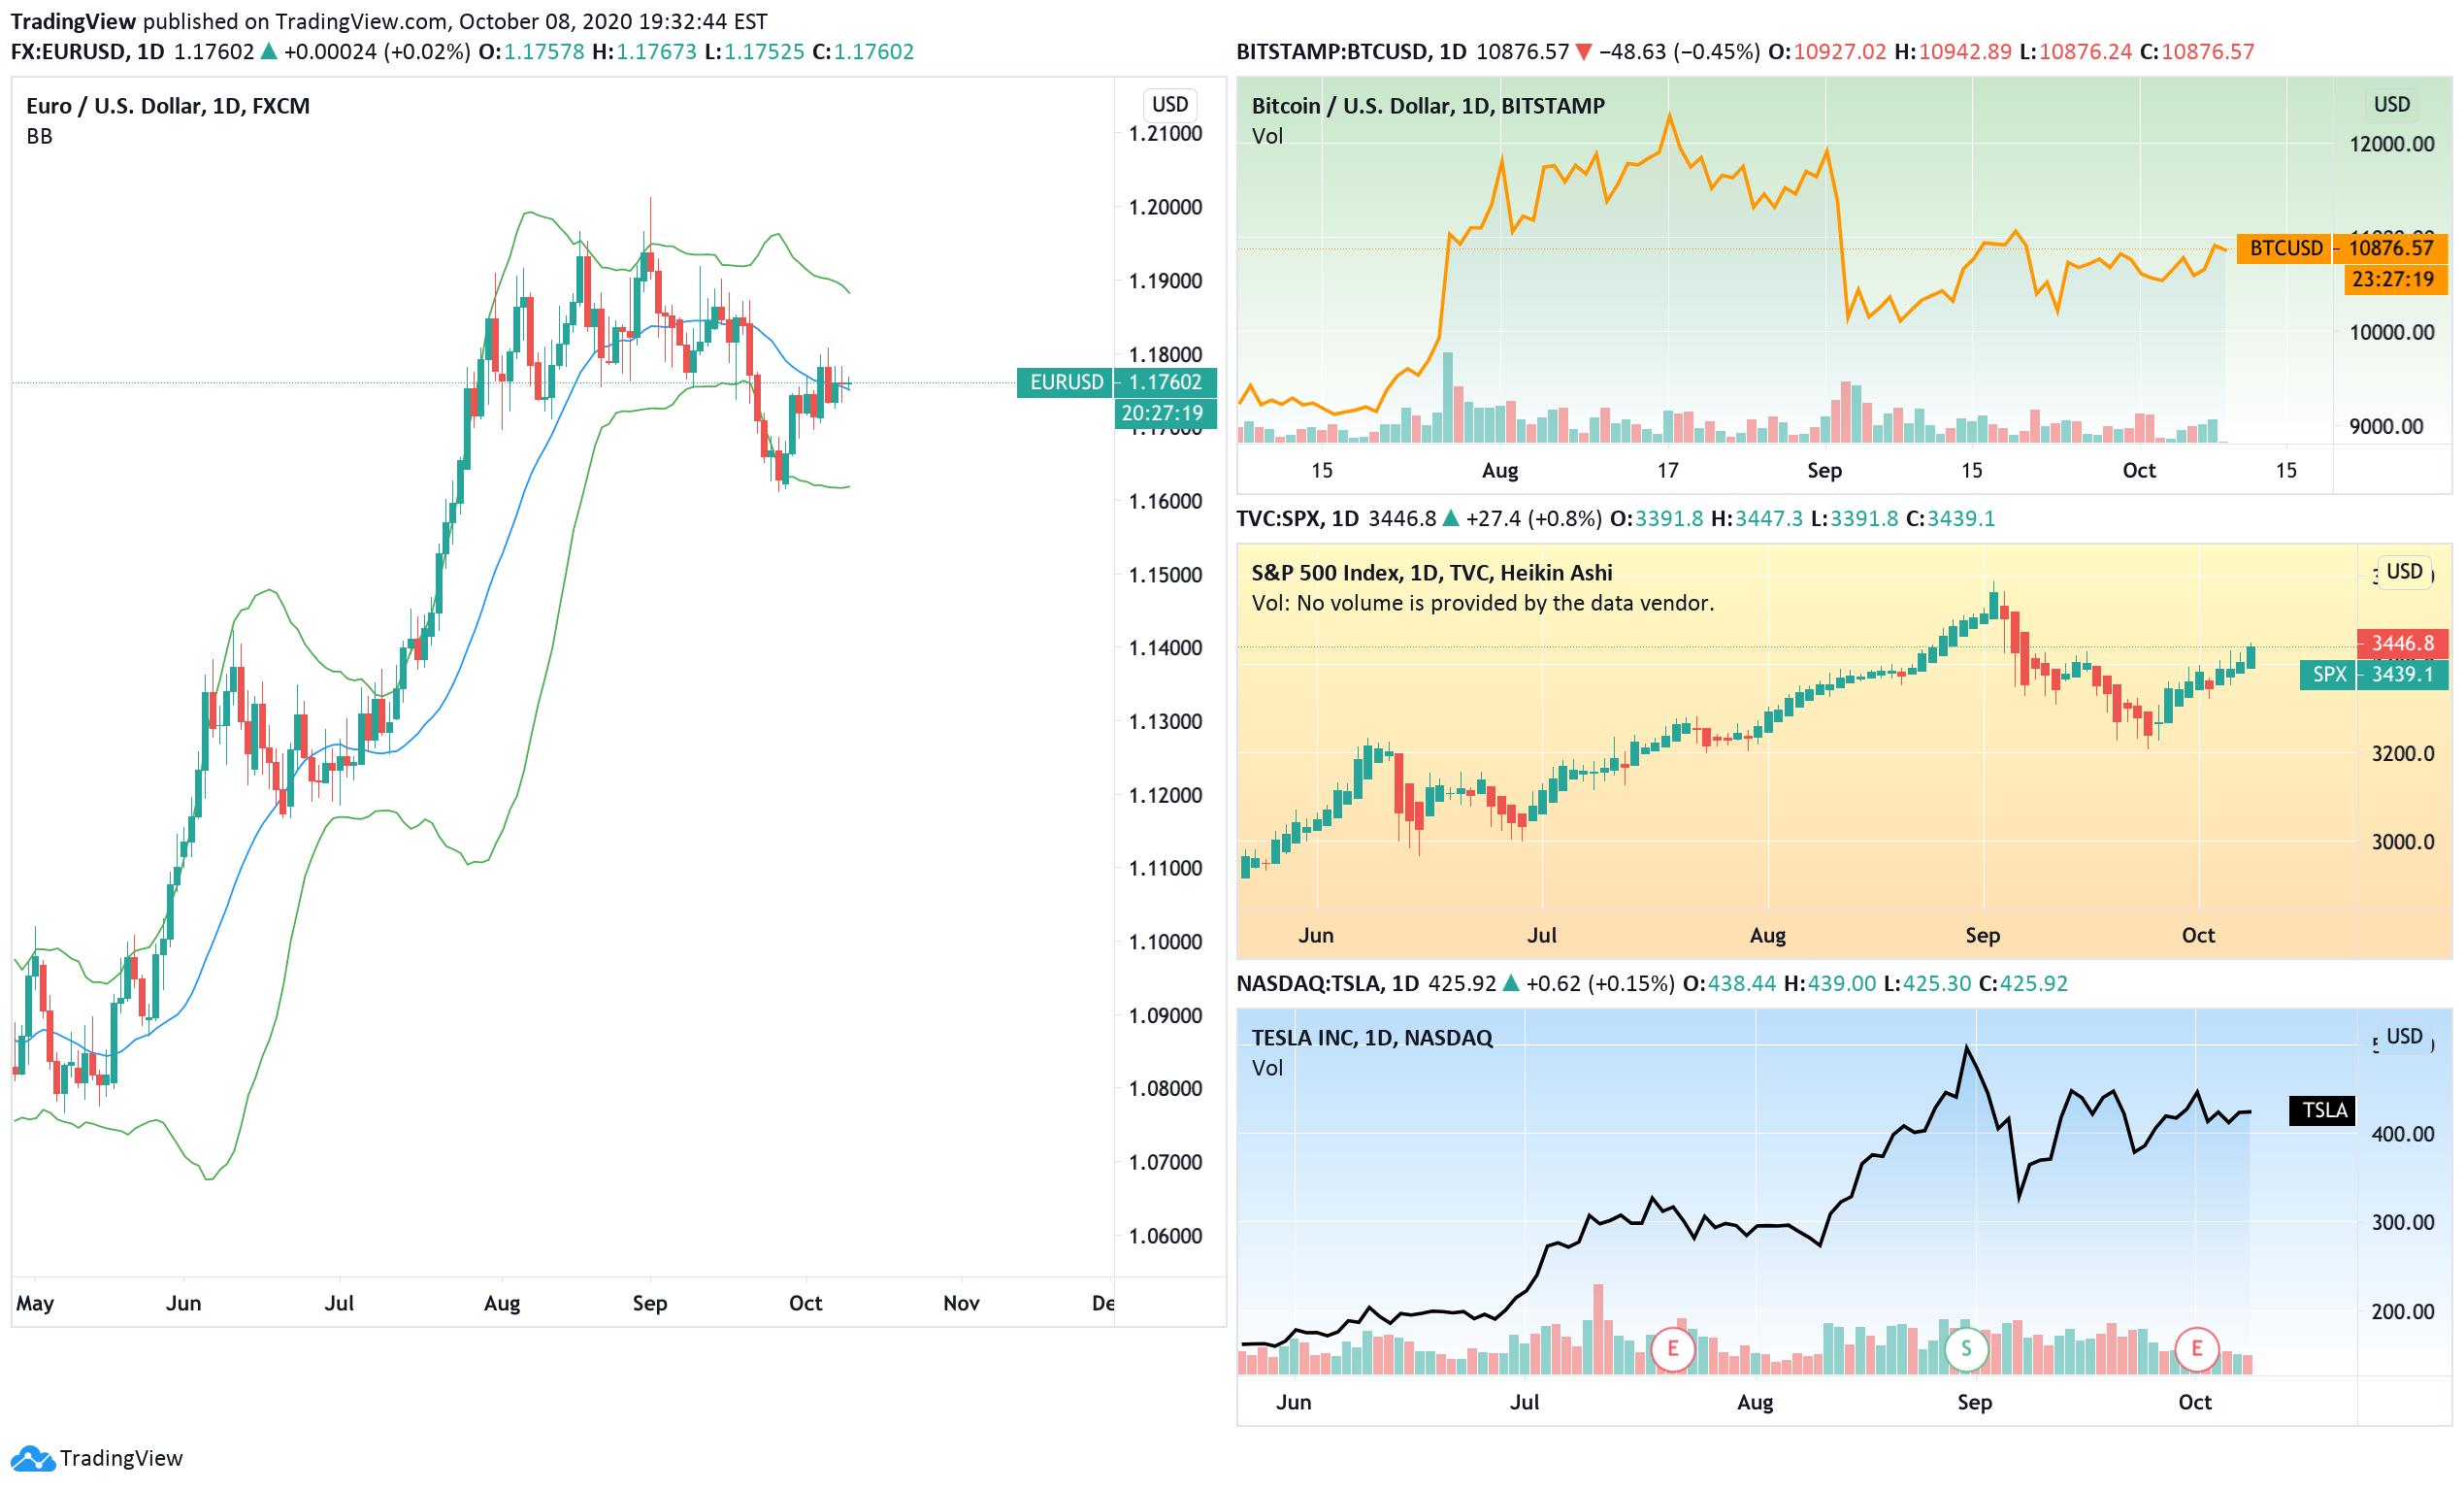
Put several charts in one workspace. Compare symbols, stack timeframes, or keep a short-term view next to a longer trend — without bouncing between tabs all afternoon.
04
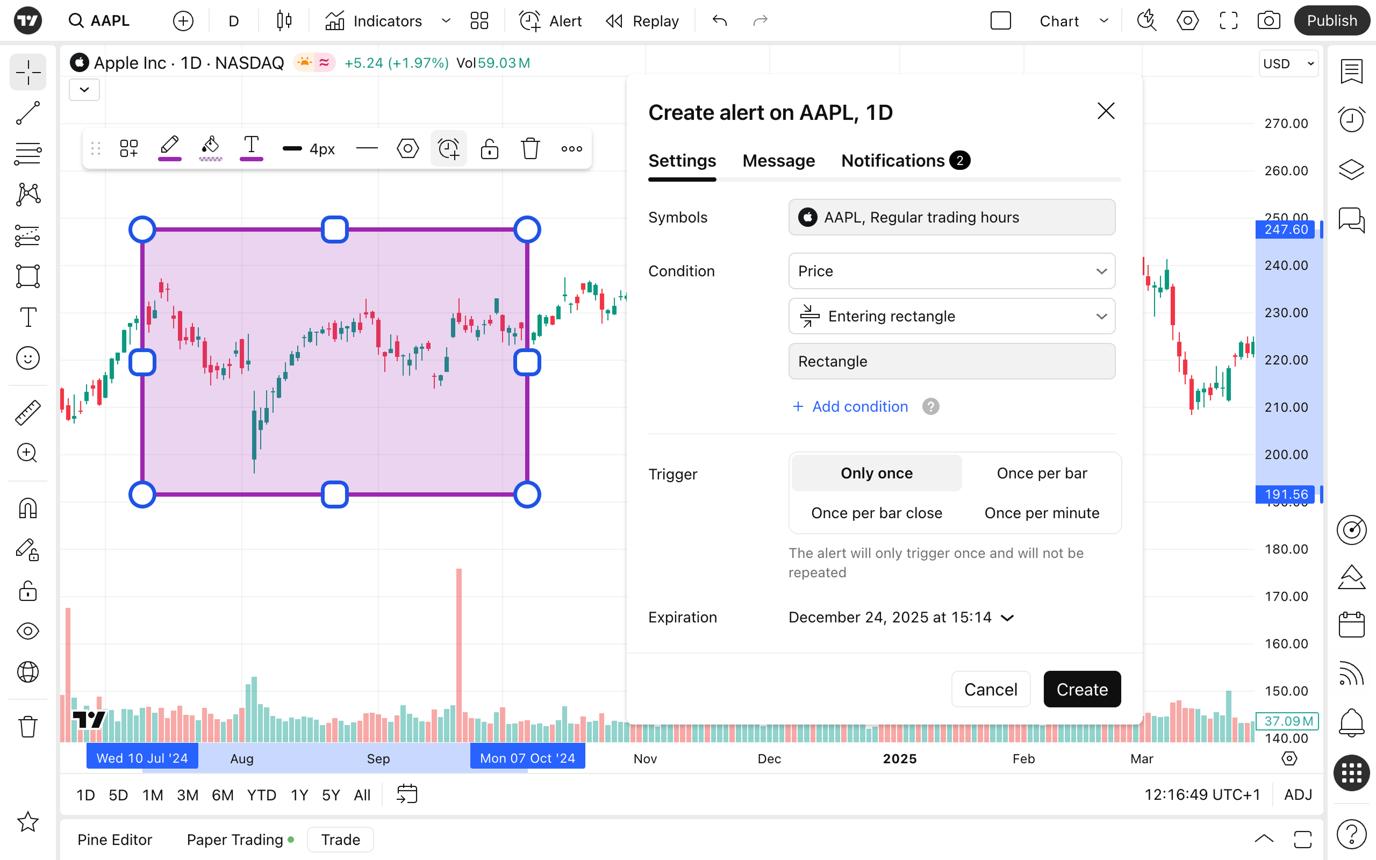
Set conditions on price, indicators, or drawings. When something you care about hits, you get the nudge — and you can spend less time refreshing the same chart.
05
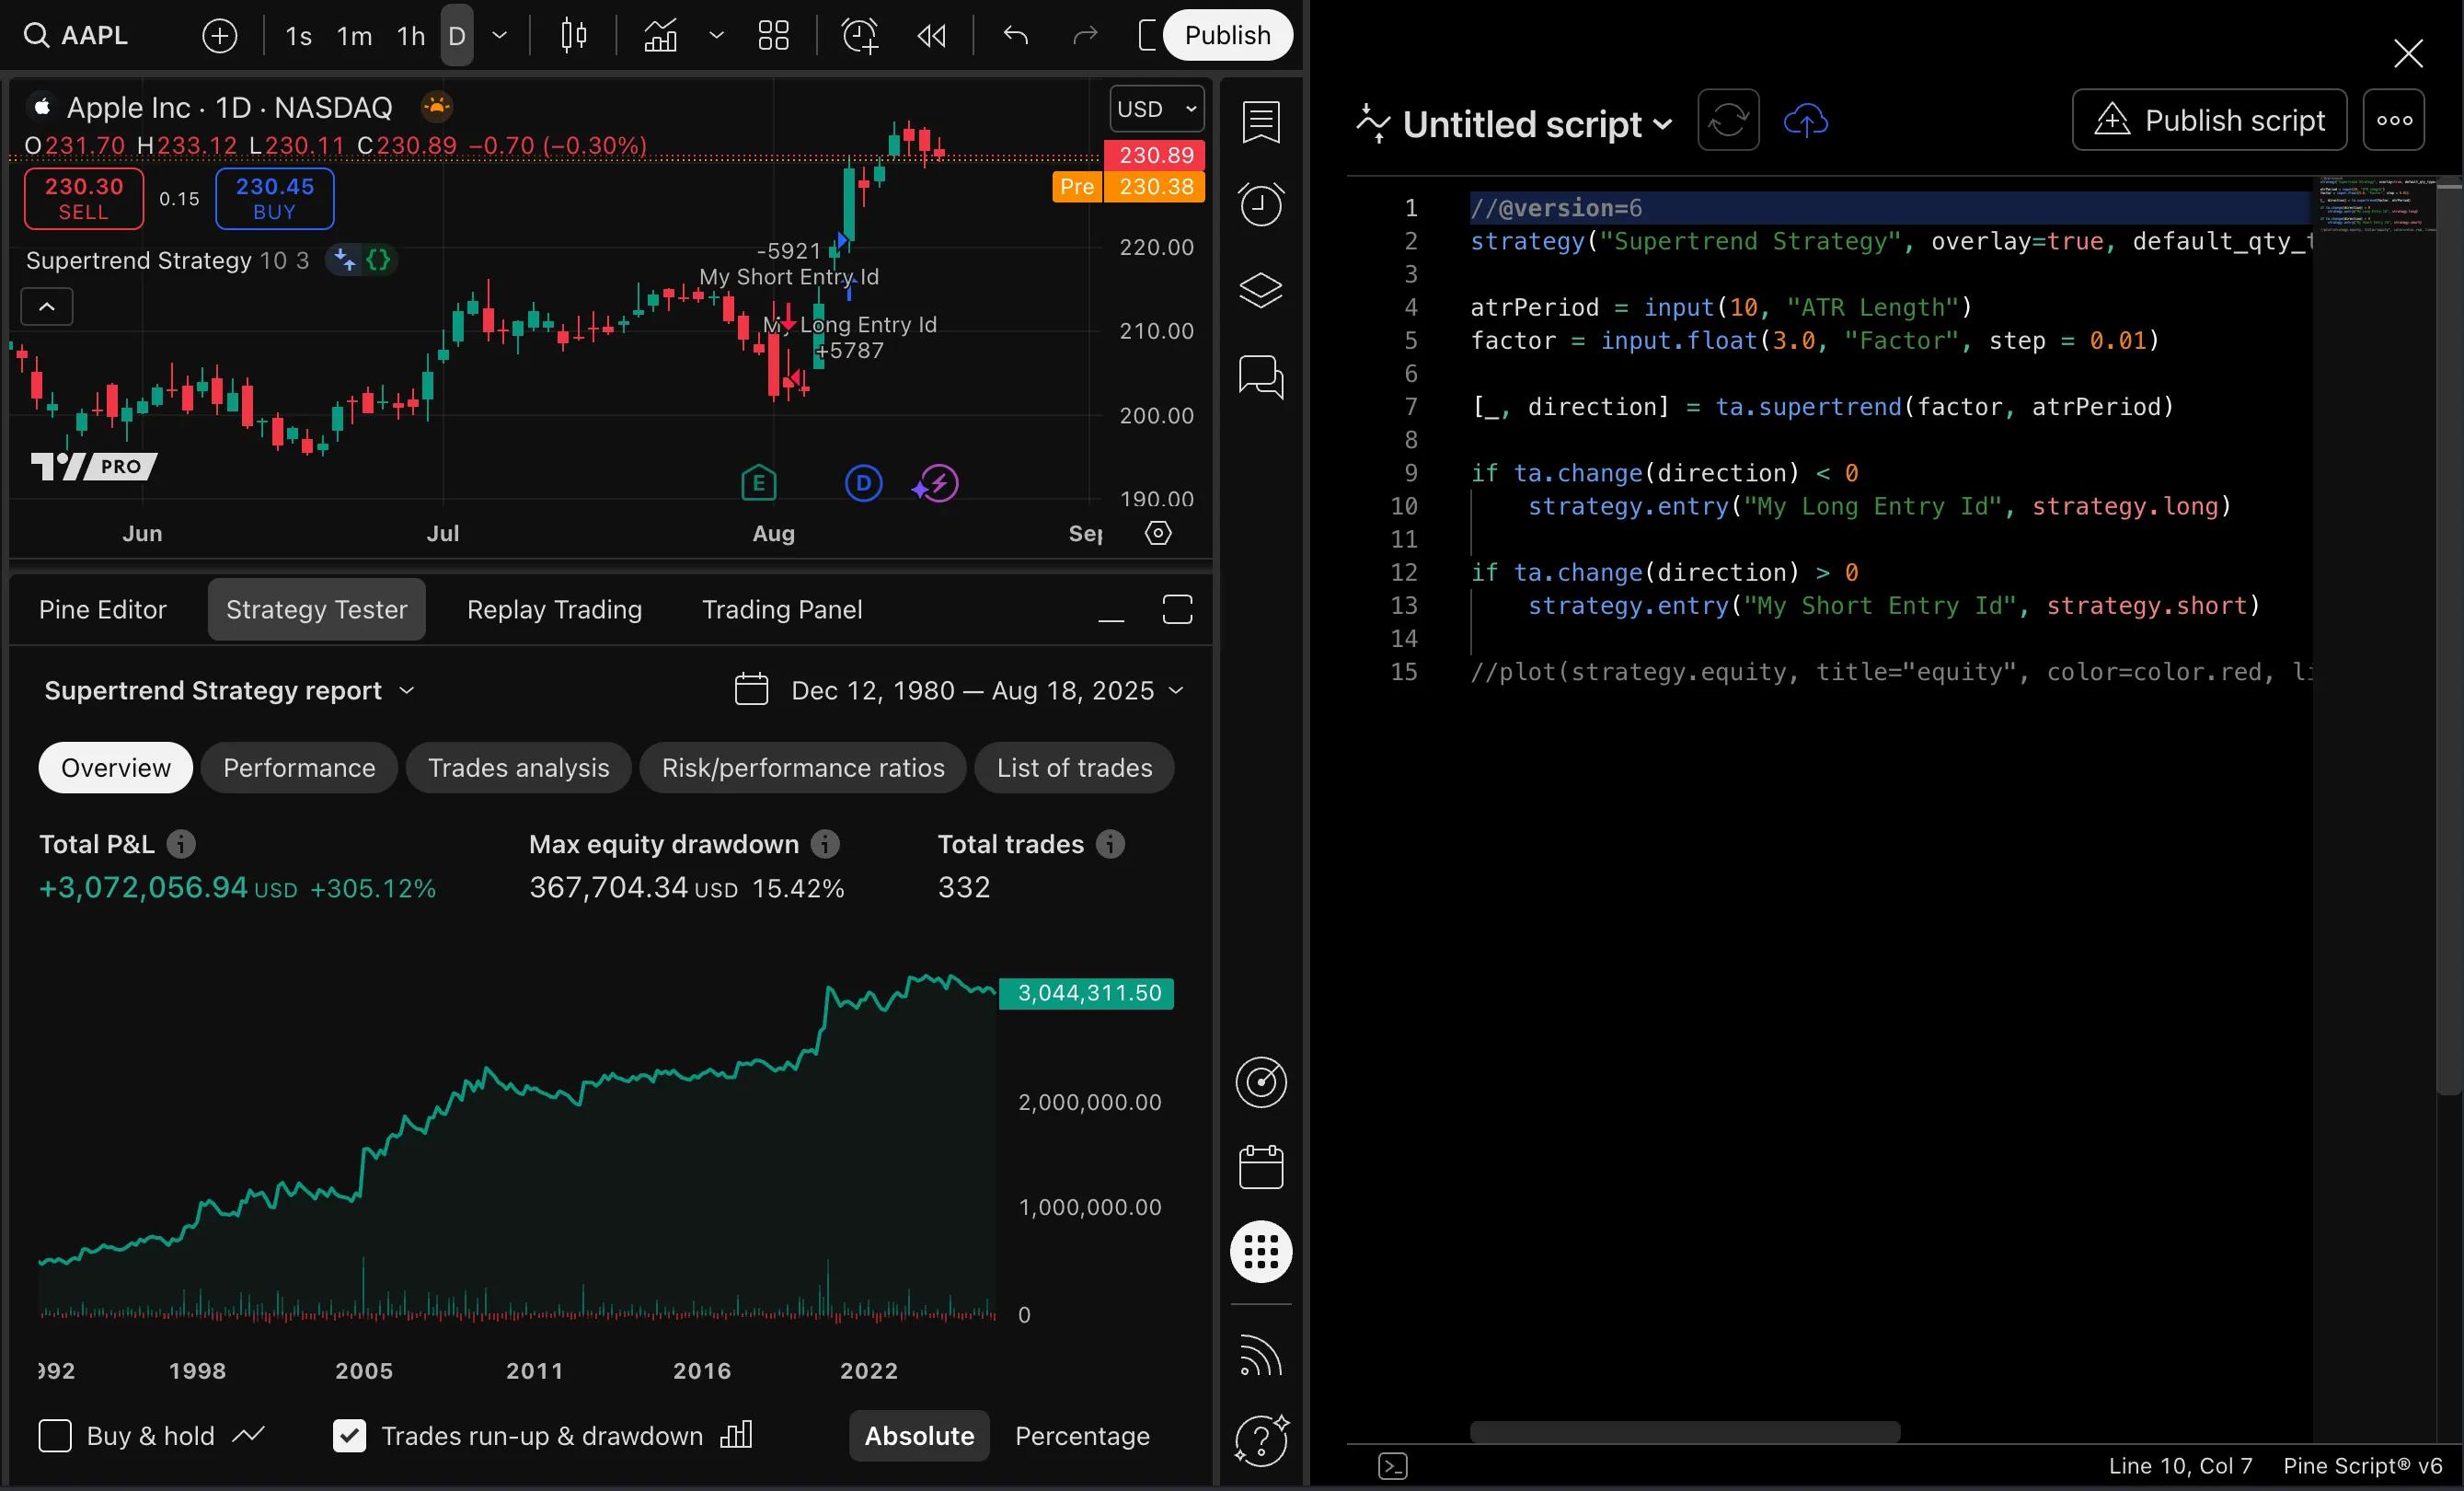
Write your own indicators and strategies, then see them on the chart. It’s a practical way to turn a research habit into something you can test and refine inside TradingView.
06
Group stocks, FX pairs, indices, and whatever else you track. Pair the list with charts and alerts so the daily check-in feels organized instead of scattered.
Feature snapshot
Watch
Park your focus symbols in a list, then use Supercharts to study structure and trend.
Research
Layer indicators for more context, and use multi-chart layouts to compare timeframes or markets.
Follow up
Use alerts for the moves that matter, and use scripts to lock in methods you’ll reuse.