

01
Multi-market data
Global markets at a glance
Follow charts and quotes across stocks, forex, indices, futures, and crypto. Use watchlists and clean data views to keep your symbols close and track price changes and history from a wider market lens.
TradingView
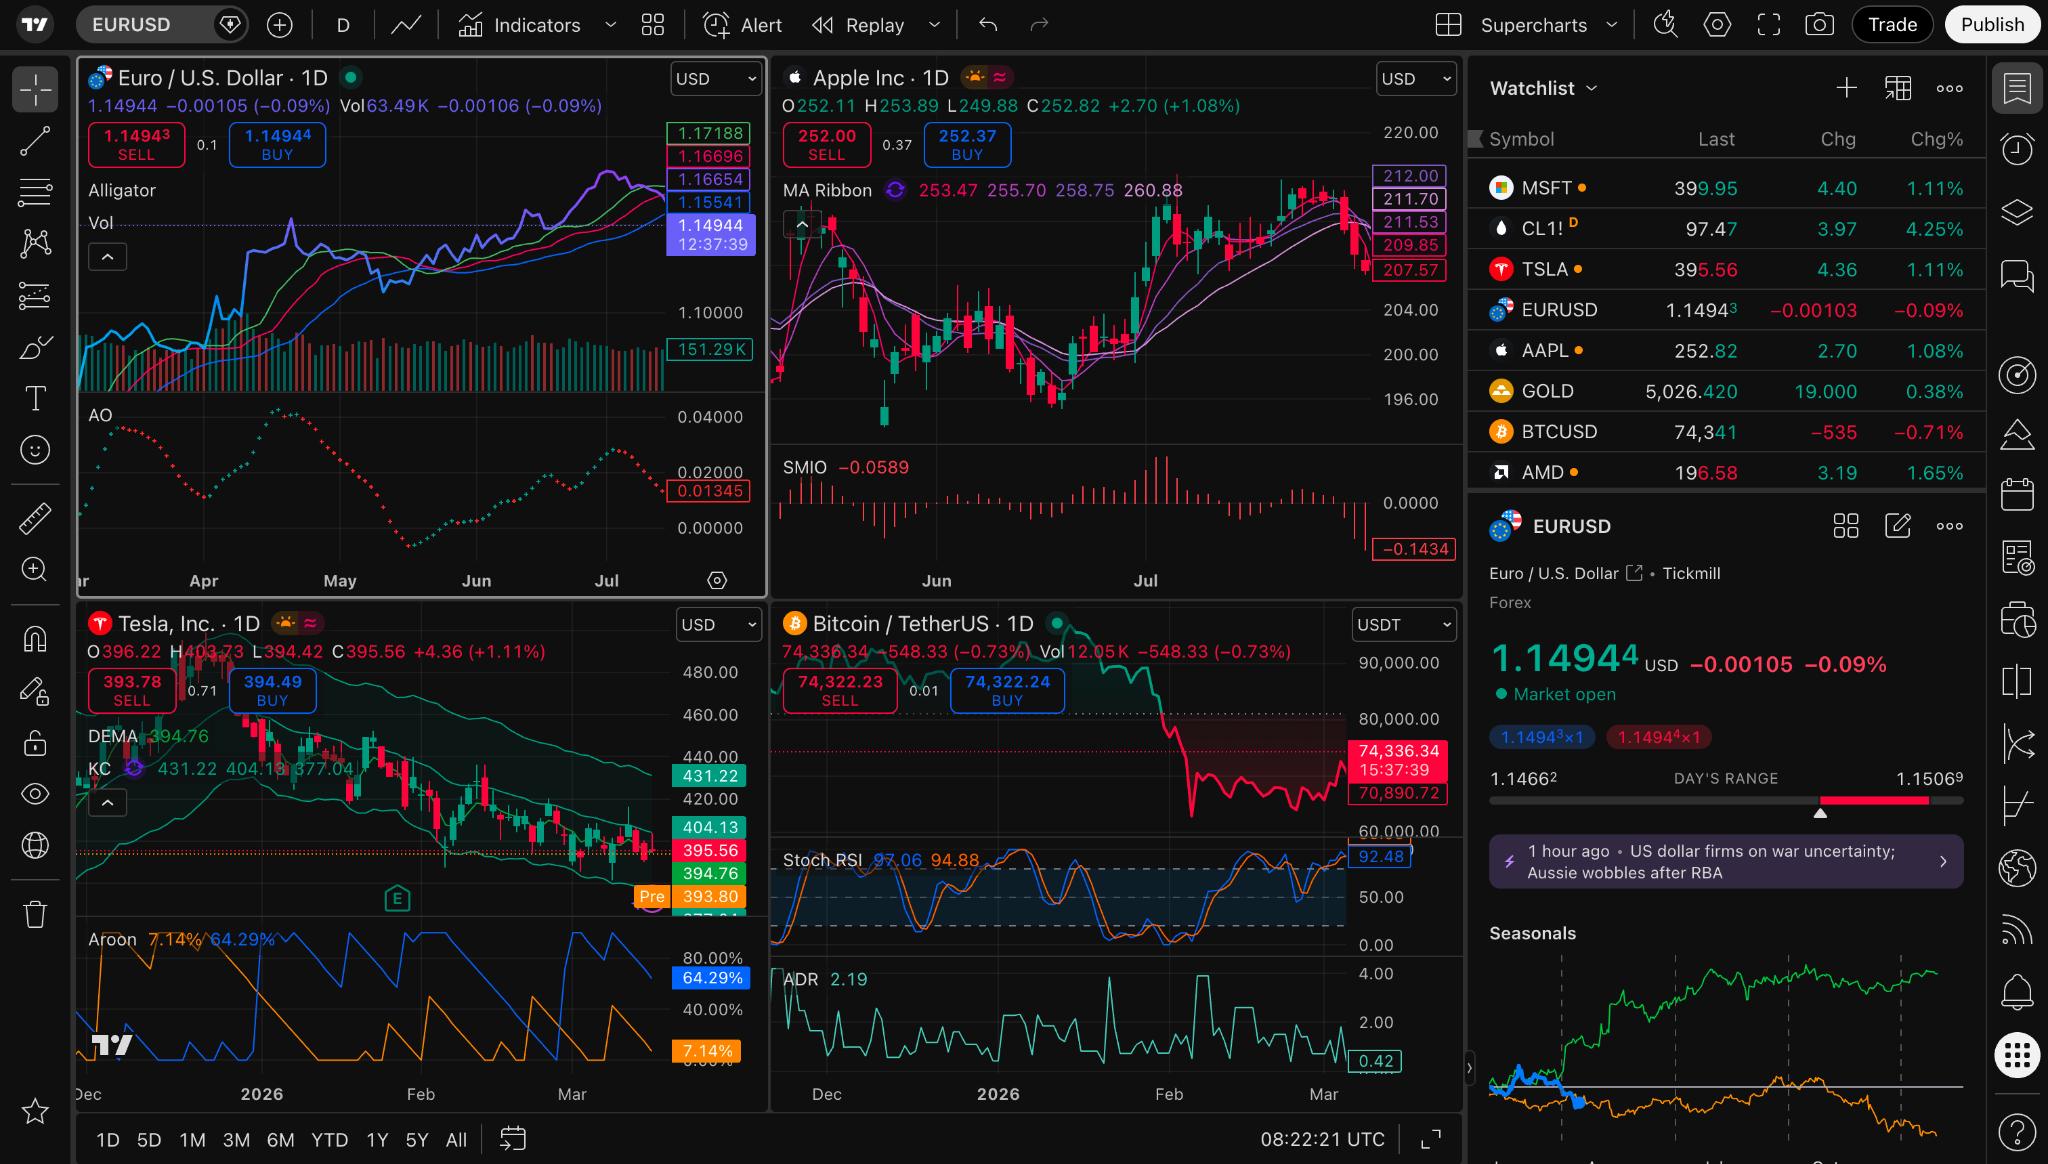
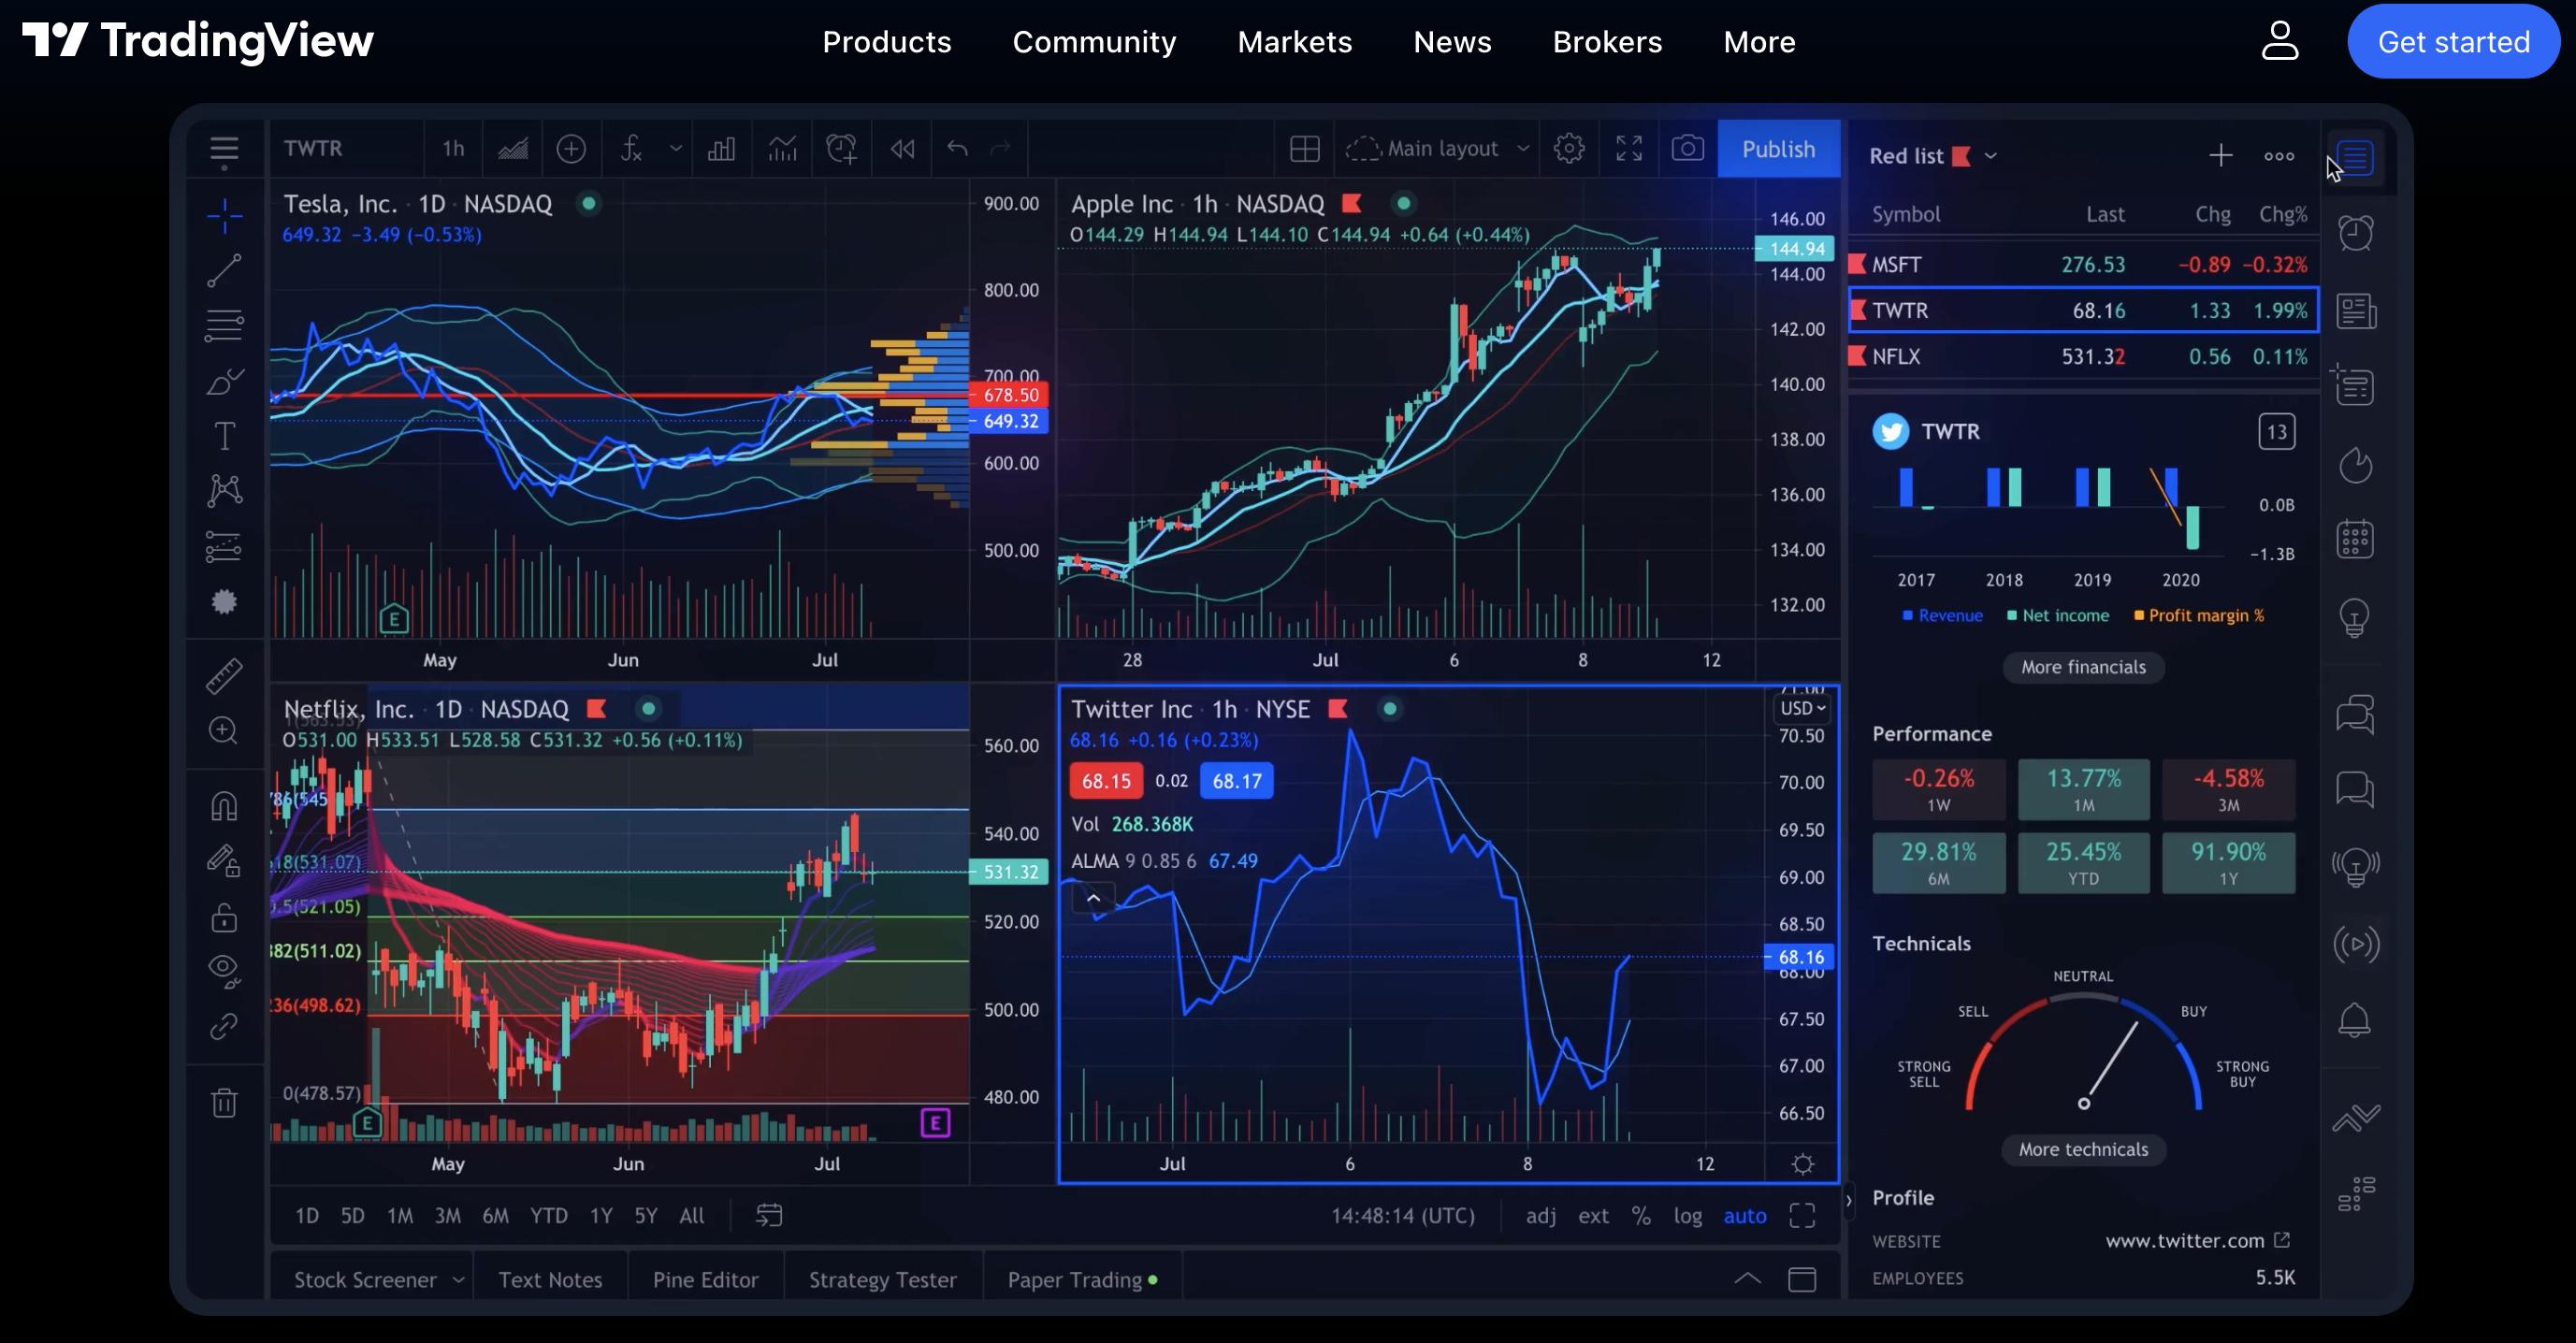
Spot market moves faster with clearer charts. TradingView brings market data, professional charts, and technical tools into one workspace. Whether you follow stocks, forex, crypto, or futures, you can study price action, map structure, and keep your ideas organized.
Platform strengths
TradingView brings global market data, professional charts, technical indicators, and smart alerts into one flexible workspace. Whether you’re new to markets or already deep into price action, you can mix the tools you need and build a research habit that feels clear — not cluttered.
01
Global markets at a glance
Follow charts and quotes across stocks, forex, indices, futures, and crypto. Use watchlists and clean data views to keep your symbols close and track price changes and history from a wider market lens.
02
More tools for reading the trend
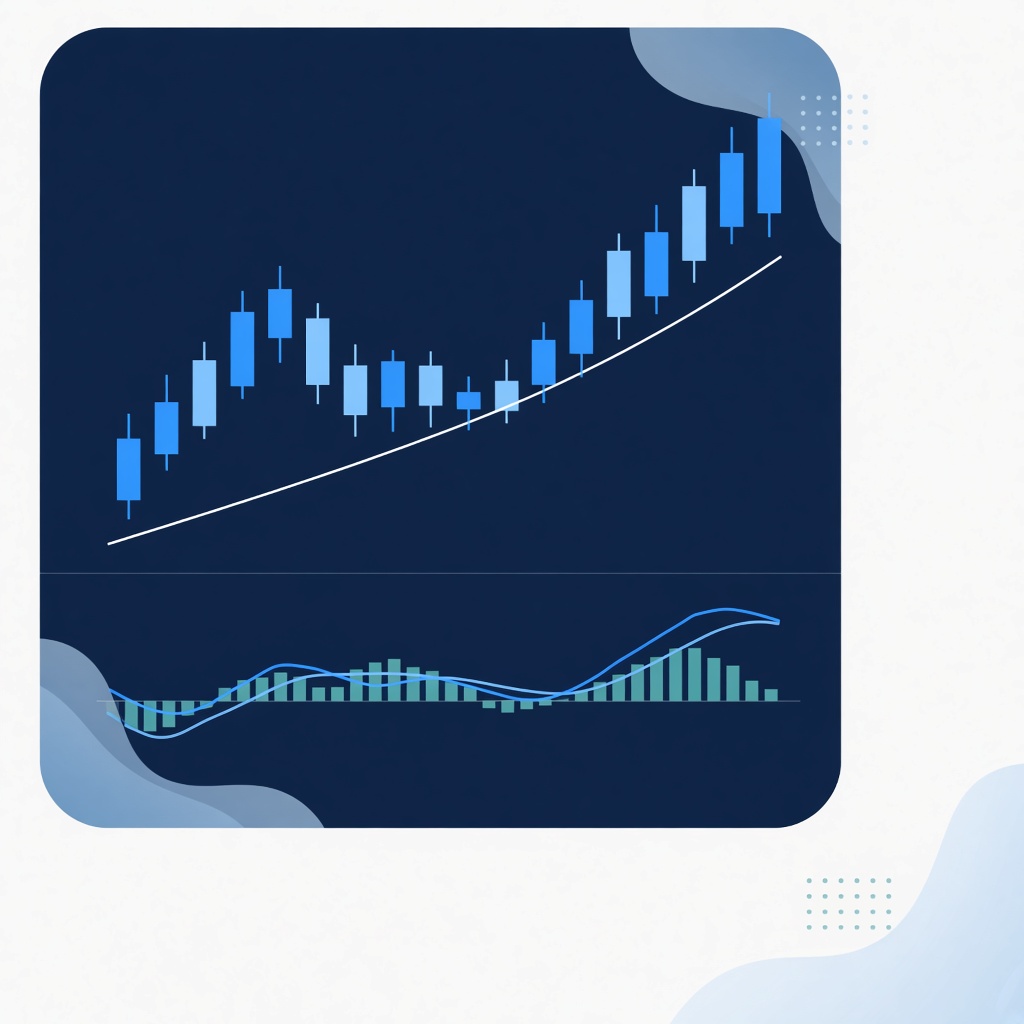
From candlesticks and trend lines to moving averages, MACD, RSI, and Bollinger Bands, you’ve got a deep toolkit. Combine approaches to study trend, momentum, and volatility — then shape a workflow that matches how you think.
03
More angles, less tab-hopping
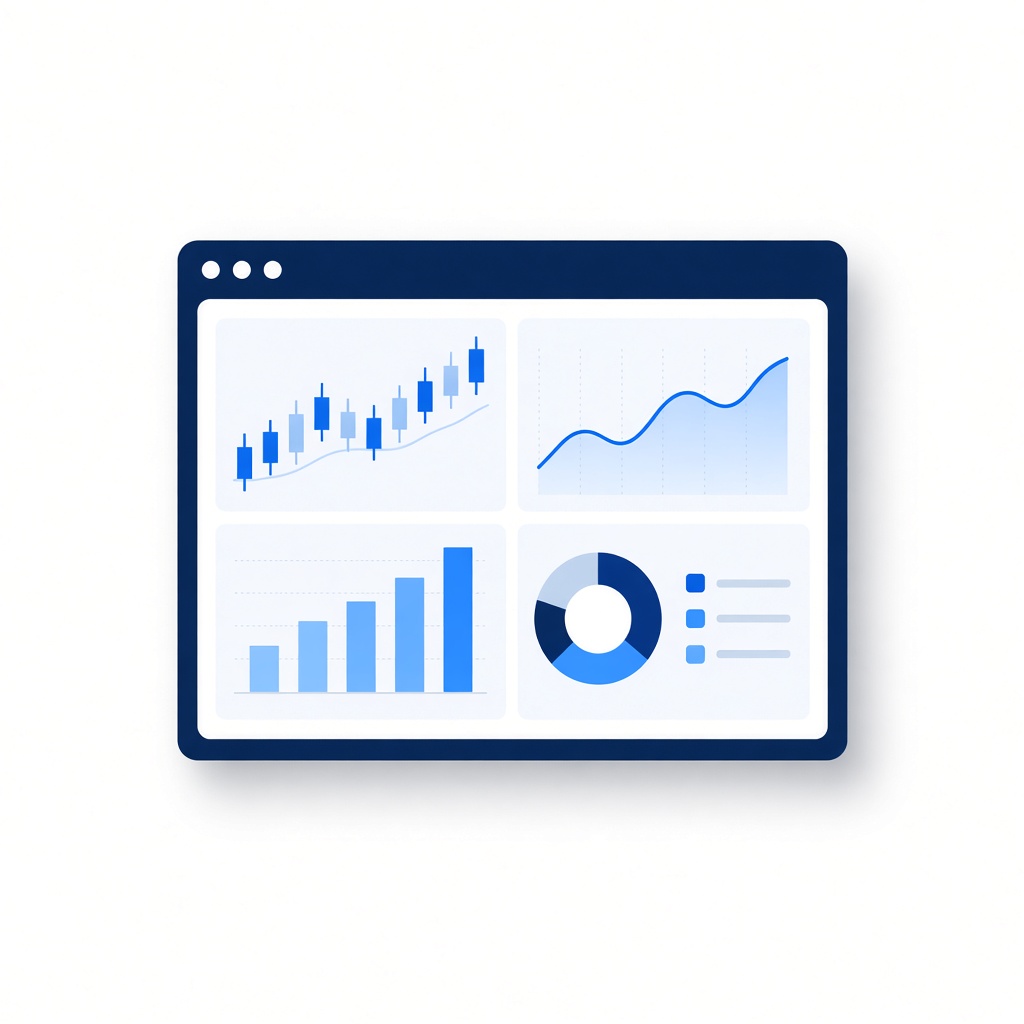
Open different symbols and timeframes in one workspace. Compare markets or stack short-term moves next to longer trends so your charts stay organized — without constant page switching.
04
Catch important moves when they matter
Set alerts on price levels, indicators, or drawings and fold them into your daily routine. You don’t have to live on the chart — plan-based alerts help you stay on top of the signals you care about.
05
Build analysis your way
Write custom indicators, shape strategies, and test ideas with Pine Script. Turn your research habits into visual tools or strategy logic — and push technical analysis further than the defaults.
06
Analyze on the device that fits the moment
Use the web app, desktop clients for Windows, macOS, and Linux, plus Android and iOS. Dig into charts on a computer, or check the markets from your phone — pick what fits the moment.
Pro charts
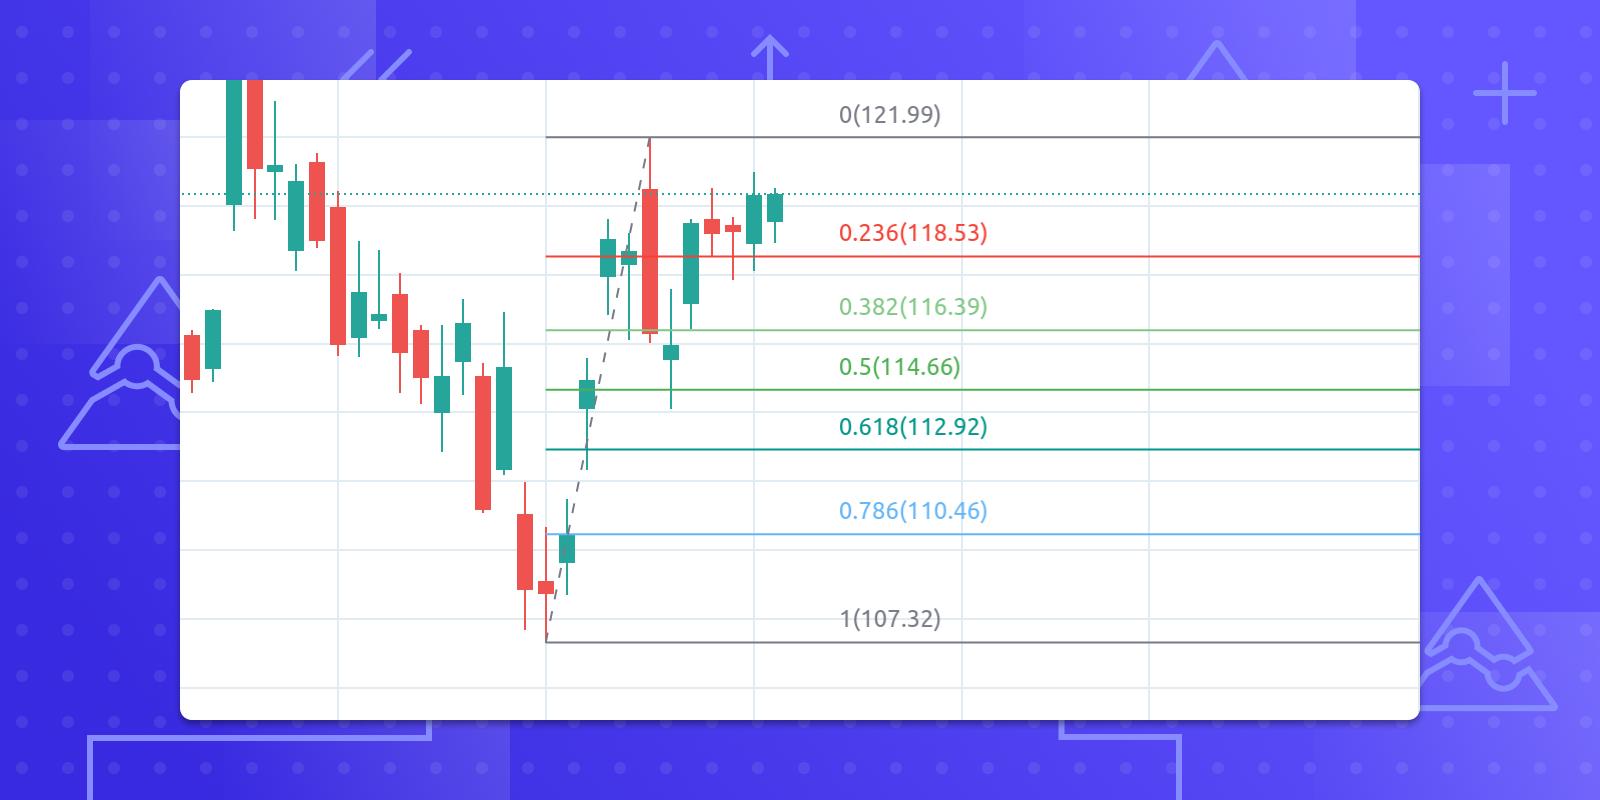
From basic candlesticks to multiple chart types — plus trend lines, Fibonacci tools, and everyday indicators — TradingView gives you a flexible visual toolkit. Tweak timeframes, styles, and parameters so you can study trends and key areas from more than one angle.
Core features
Every tool should help you understand the market a little better.
TradingView isn’t only clean market charts. It folds rich indicators, smart alerts, multi-chart layouts, and custom strategy tools into one analysis space. From watching price action and marking key areas to managing watchlists and testing ideas, six core features help you build a research flow that’s both flexible and systematic.
01 · Supercharts
Use professional candlesticks, multiple chart types, and flexible timeframes to view price from different angles. Add trend lines, Fibonacci retracements, and other drawings to study structure, support/resistance, and history in a setup that feels like yours.
02 · Technical indicators
Work with popular indicators for trend, momentum, and volatility. Mix moving averages, MACD, RSI, Bollinger Bands, and more so your read on price isn’t stuck on a single lens.
03 · Smart price alerts
Create alerts for price levels, indicator changes, or drawing conditions. When price nears a key area or your conditions fire, you can get notified and skip the constant refresh.
04 · Multi-chart layouts
Bring different symbols, chart types, and timeframes into the same layout. Compare markets or watch short-term noise next to longer trends — and keep multi-angle research moving.
05 · Pine Script strategies
Use Pine Script to build custom indicators, write strategy logic, and backtest on history. From simple combinations to richer conditions, design tools around how you actually research.
06 · Watchlists
Organize stocks, forex, indices, futures, and crypto into personal lists. Jump to quotes and price changes faster — with less searching and fewer random page hops.
From intuitive Supercharts to flexible Pine Script, from indicator work to multi-market views — TradingView packs a lot for different stages of analysis. Dig into the toolkit and shape a workflow that feels personal.
FAQ
You can start for free. Paid plans unlock more indicators, alerts, multi-chart layouts, and similar extras. What’s included depends on TradingView’s current plan page.
Yes. There’s a web version, desktop apps for Windows / macOS / Linux, and mobile apps for Android and iOS. Sign in with the same account to keep supported layouts, watchlists, and settings in sync.
TradingView is mainly a charting and analysis platform. In some regions you can connect supported brokers and trade from the platform. This site doesn’t offer brokerage or investment advice.